
How to Review Your Instagram Insights
/
Let’s learn about Instagram Insights!
Let’s be real: how often do you regularly review your Instagram Insights? For many business owners, looking at your analytics quickly falls to the bottom of your to do list. It’s daunting! There’s confusing jargon and the data can be tricky to interpret. That’s why today on the blog, I’m walking you through how to review your Instagram Insights so you can use them to take meaningful action.
How to Access Instagram Insights
To access your Instagram Insights, you must have a business profile. If you don’t have a business profile, check out this handy guide from Later to get yours set up.
Once you’re in the app, head to the three lines in the upper right corner. Tap there, and then tap Insights. Here, you’ll be able to take a look at all the metrics about the content you post, the actions people take on your account, and who your audience is. Let’s dive in!

How to find Insights. All examples today are from my passion project, I Heart ROC
The Content Tab
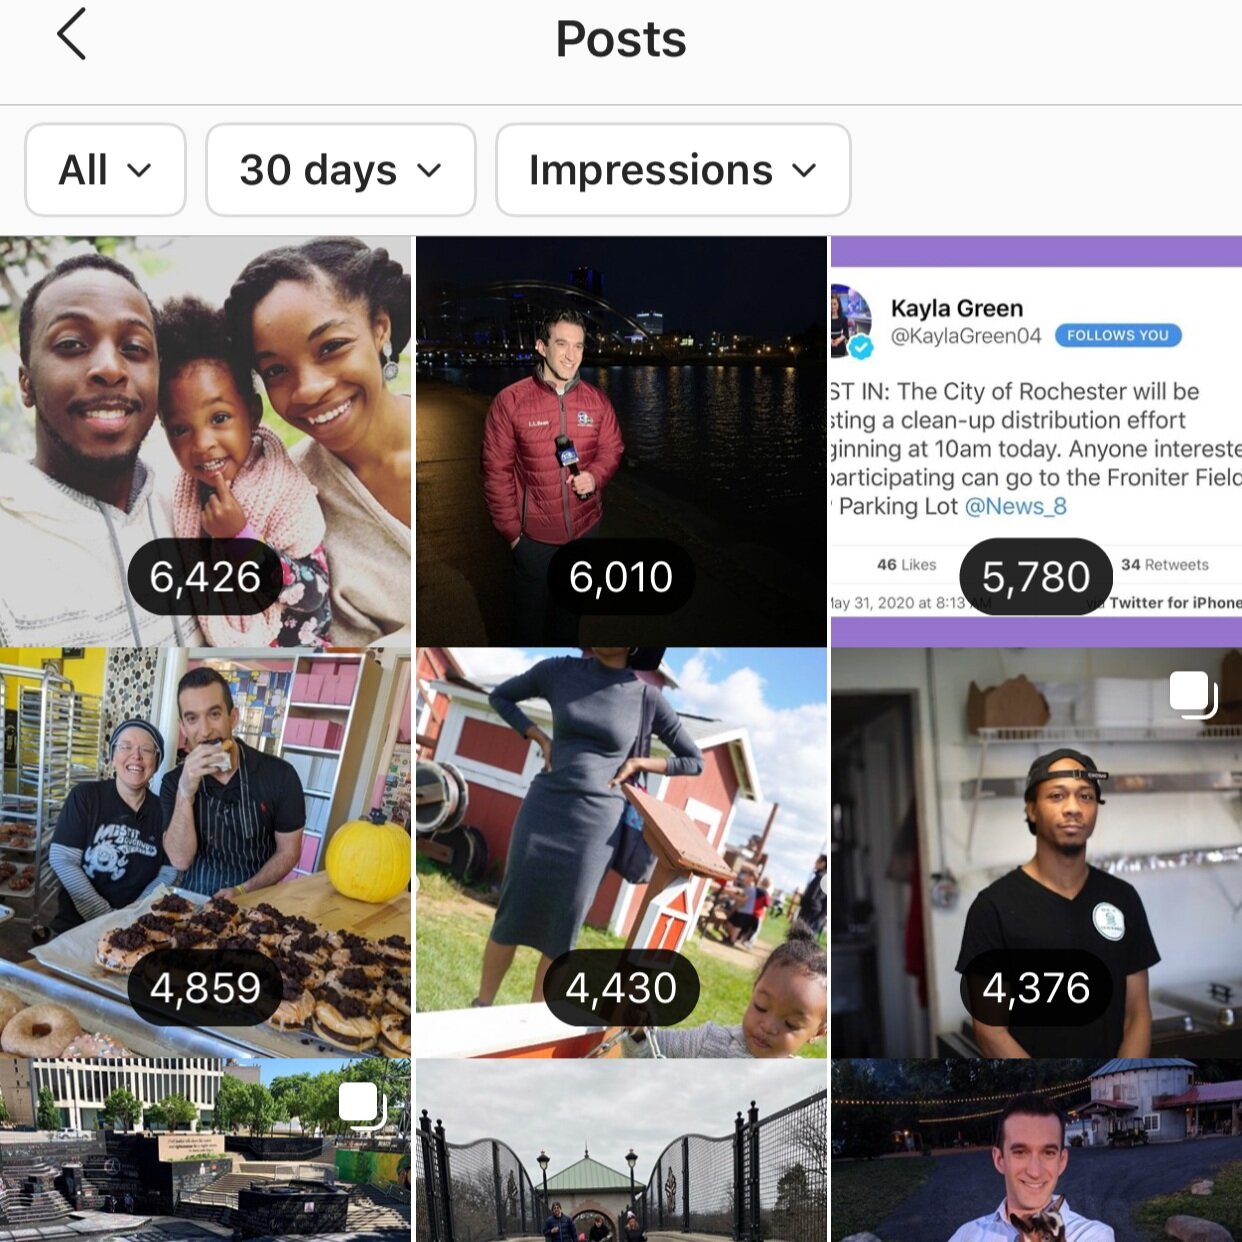
On the content tab, you’ll be able to see how many likes a post received, how many impressions, what the reach was, how many times it was saved or sent to people, and much more. You can filter by time frame as well, looking at the past 7 days, the past 30 days, or even a whole year. I usually look at one 30 day window at a time so it doesn’t get too overwhelming.
A few of the most important things to review when looking at the content tab are your impressions, reach, and engagement. Impressions are how many times a post is seen; reach is how many unique views a post gets. That means that if Reggie sees a post three times, it’s counted as three impressions, but it only counts once for reach. If you run into any terms you don’t know, be sure to check out my social media glossary for definitions.
Engagement is a great way to see how much people care about your content--more than just how many are seeing it. To calculate your engagement rate, you need to add up your likes + comments and divide by number of followers. Generally, a “good” engagement rate is anywhere from 1-3%. If your engagement rate is 5% or higher, that’s considered especially great!
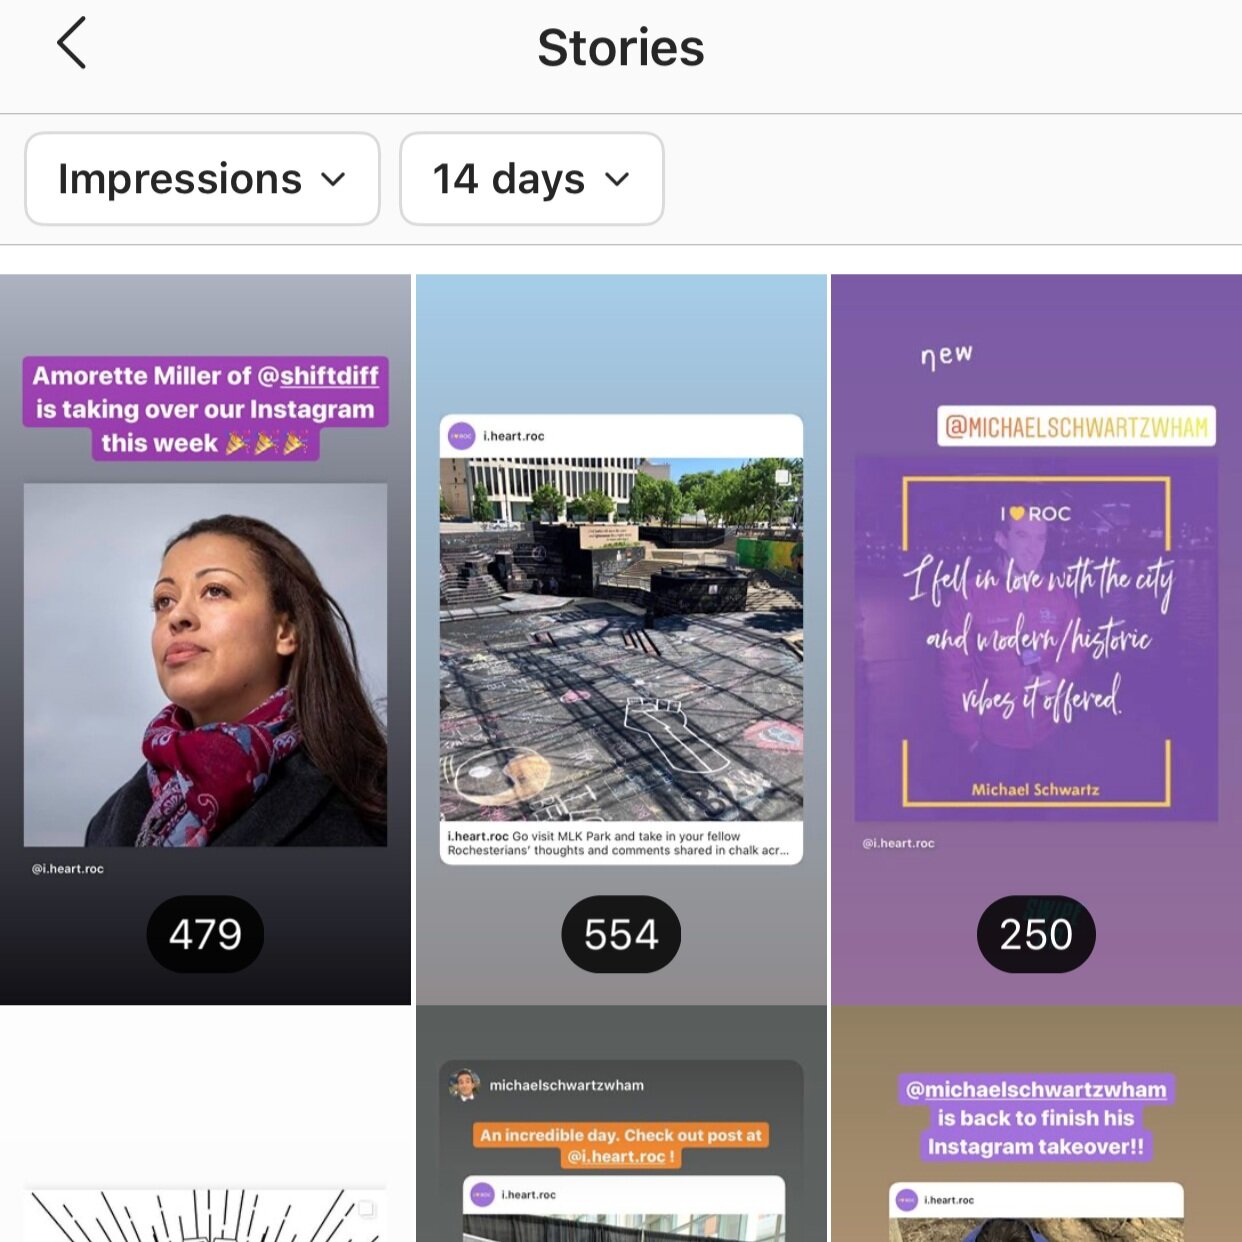
When looking at the content tab, you can review the performance of both your in-feed posts and your stories. You can only view story data from the past 14 days, so keep that in mind if you’re looking to check back on an older story. For stories, you can also measure things like how many people visited your profile, how many replied to the story, how many exited out of the story, and more.
The Activity Tab
When you visit the activity tab, you’ll be able to glean all kinds of data about what interactions are taking place on your account. You can see how many people have visited your profile, how many have clicked on your website, and how many accounts you’ve reached in a given time frame.
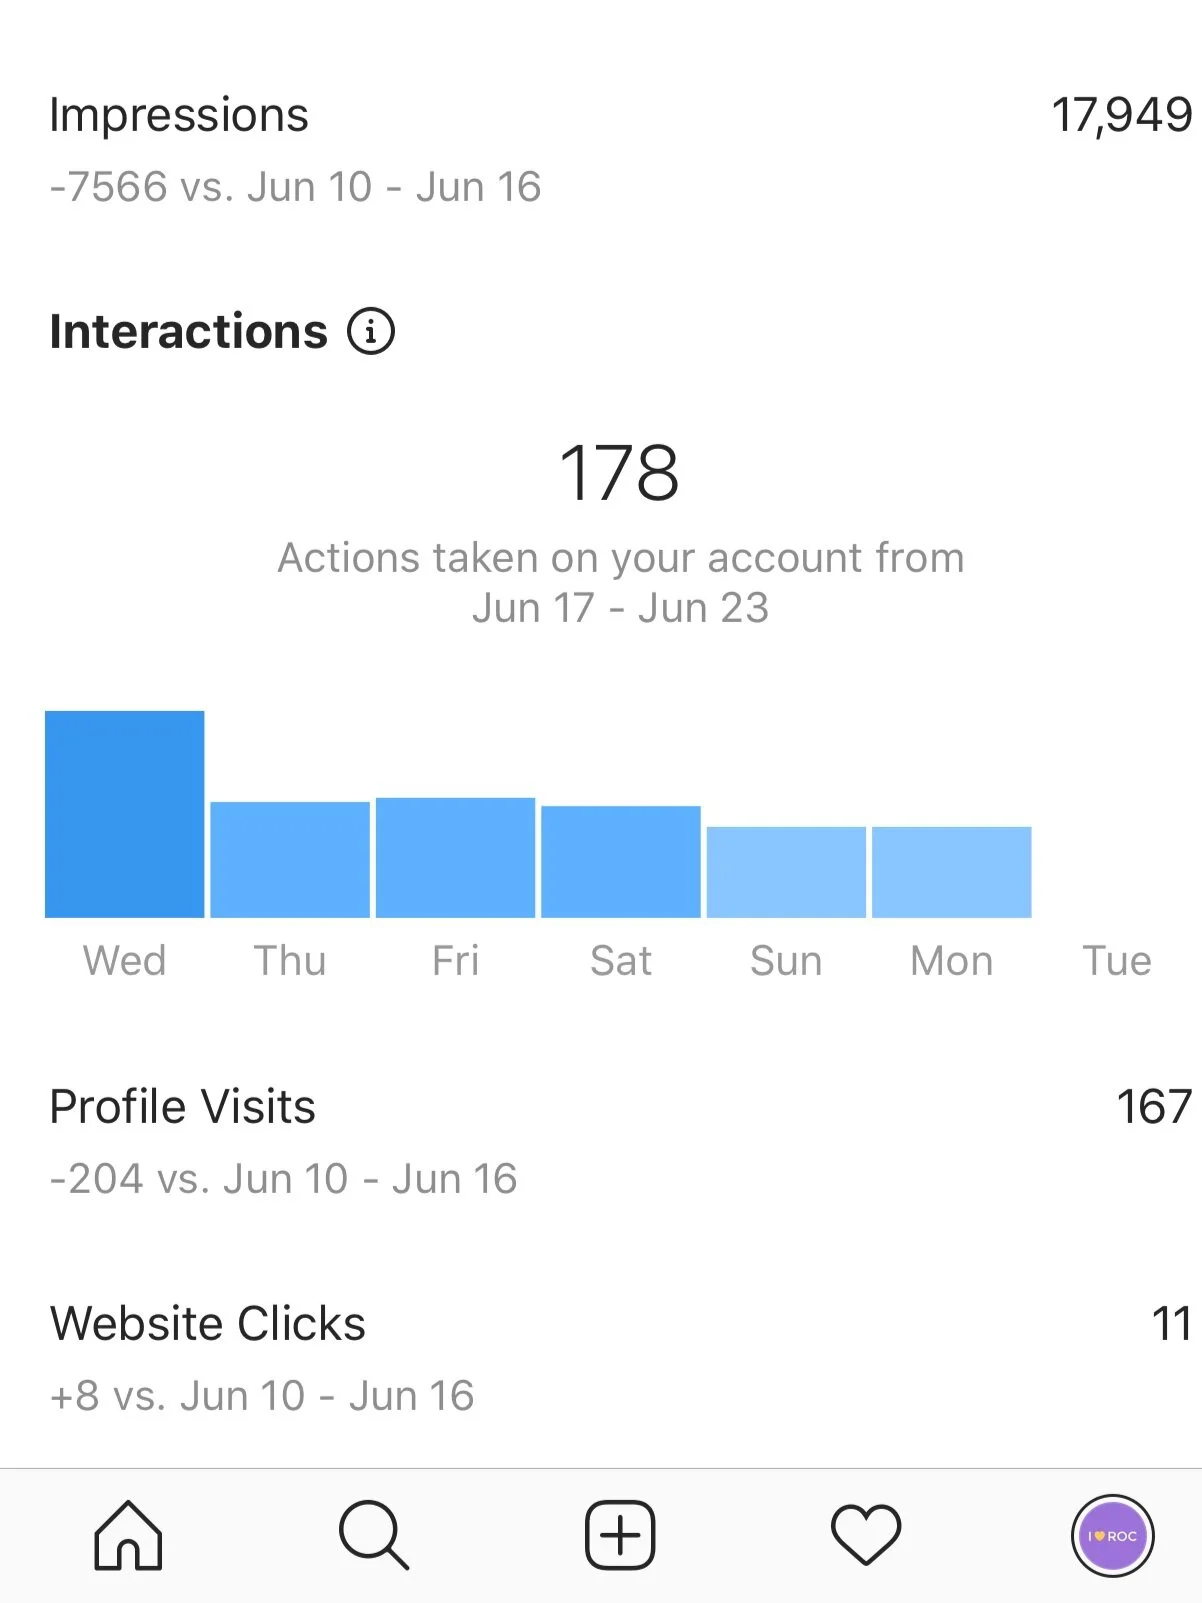
Interactions taken on I Heart ROC’s Instagram in one week, including profile visits and website clicks
It’s also helpful to set up Google Analytics on your website so you can see how Instagram fits into the big picture of how people are finding your website. For many businesses, Instagram accounts for a small percentage of their traffic--but that doesn’t mean it’s not worth your time! It’s hard to get people to click on links and leave the platform. Engagement tends to happen on the platform and it can be a great way to build brand loyalty and help followers become avid brand advocates. For example, I own ThirdLove bras and a Burrow couch, but their excellent Instagram accounts make me like both brands even more!
The Audience Tab
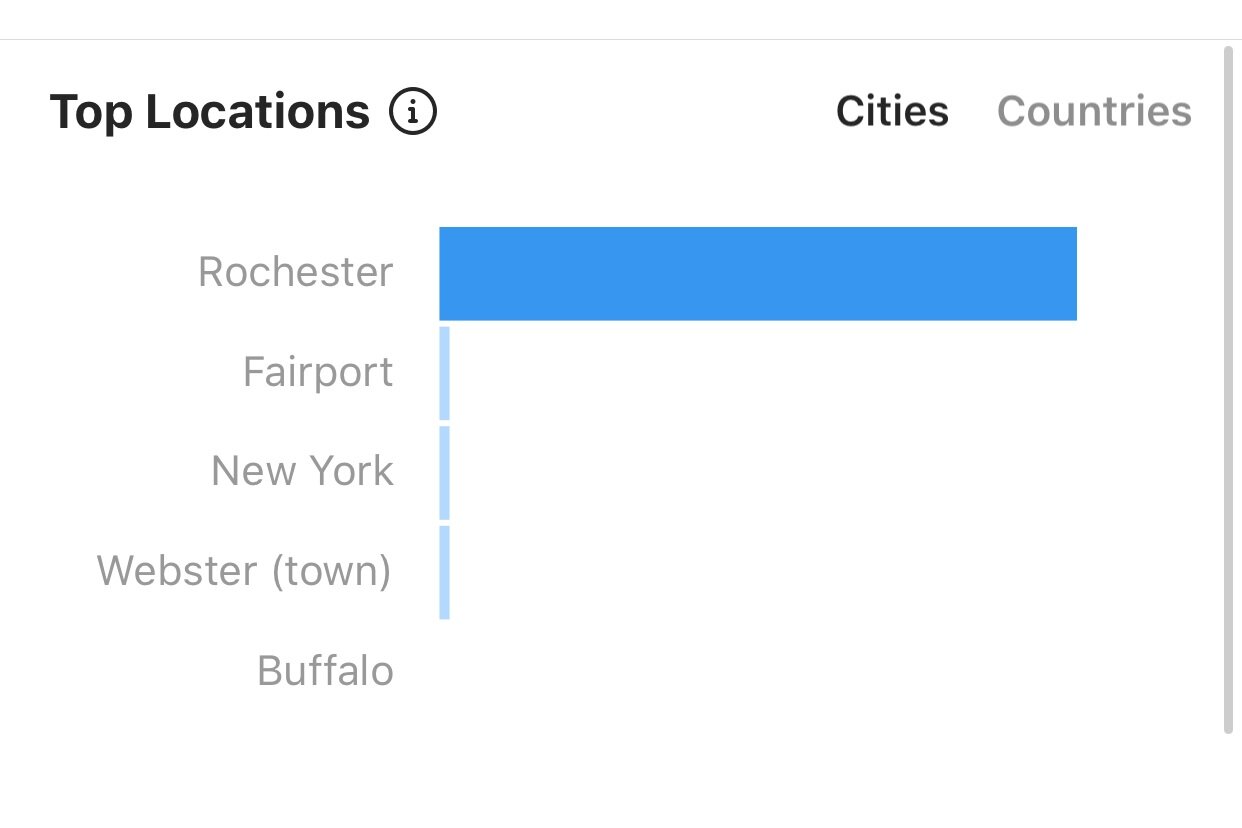
Knowing your audience is crucial for any kind of marketing, but it’s especially true of social media marketing. Who are you talking to? How old are they? Where do they live? When are they online? You can find all of that information in the audience tab!
Here, you can view top locations, including a list by city and by country. This can help your figure out what time zones your followers are in (which can help you determine the best posting time) or if many of them live in non-English speaking countries. So helpful to know!
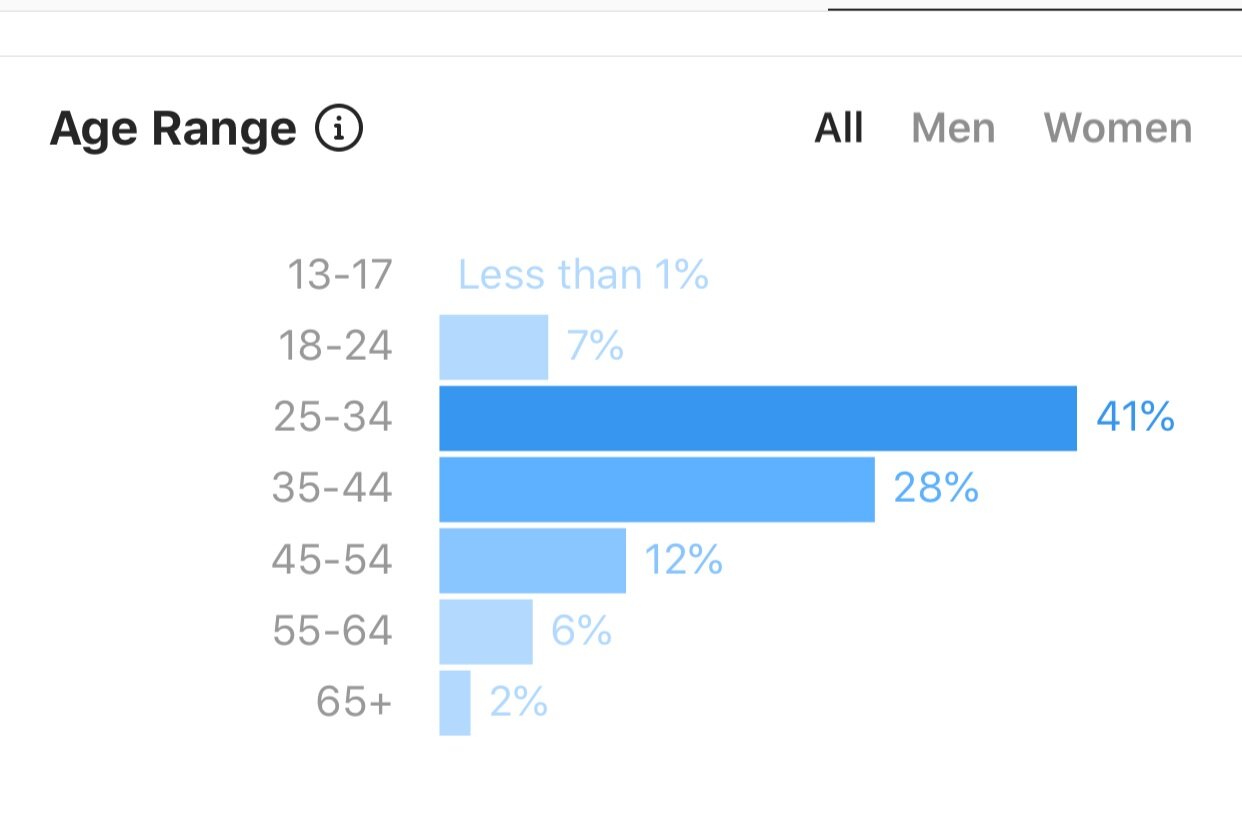
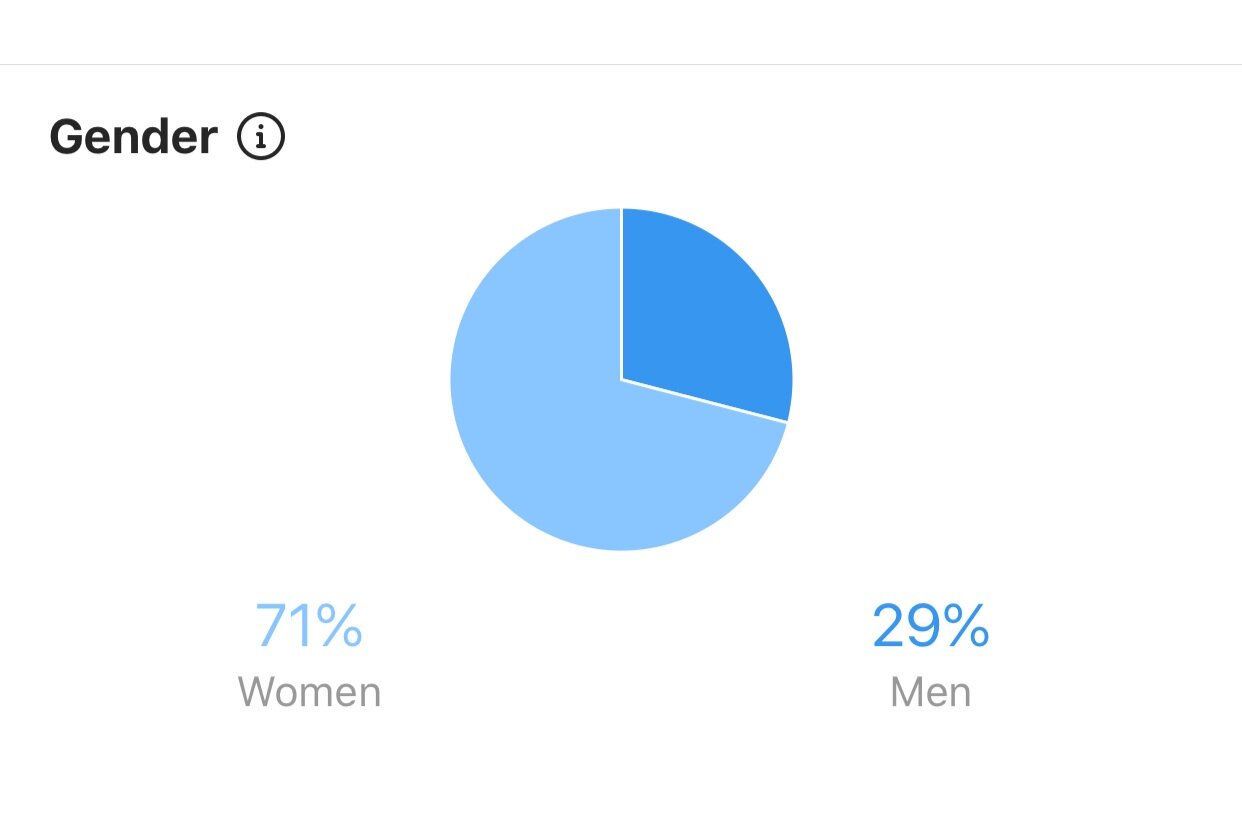
You’ll also want to take a look at the age range and gender breakdown. Knowing if your audience skews more male or female, or if you’re reaching a younger or older demographic, can be helpful in tailoring your content. If you’re reaching a younger audience than you realized, maybe you’ll want to try throwing in a funny meme and seeing how they respond!
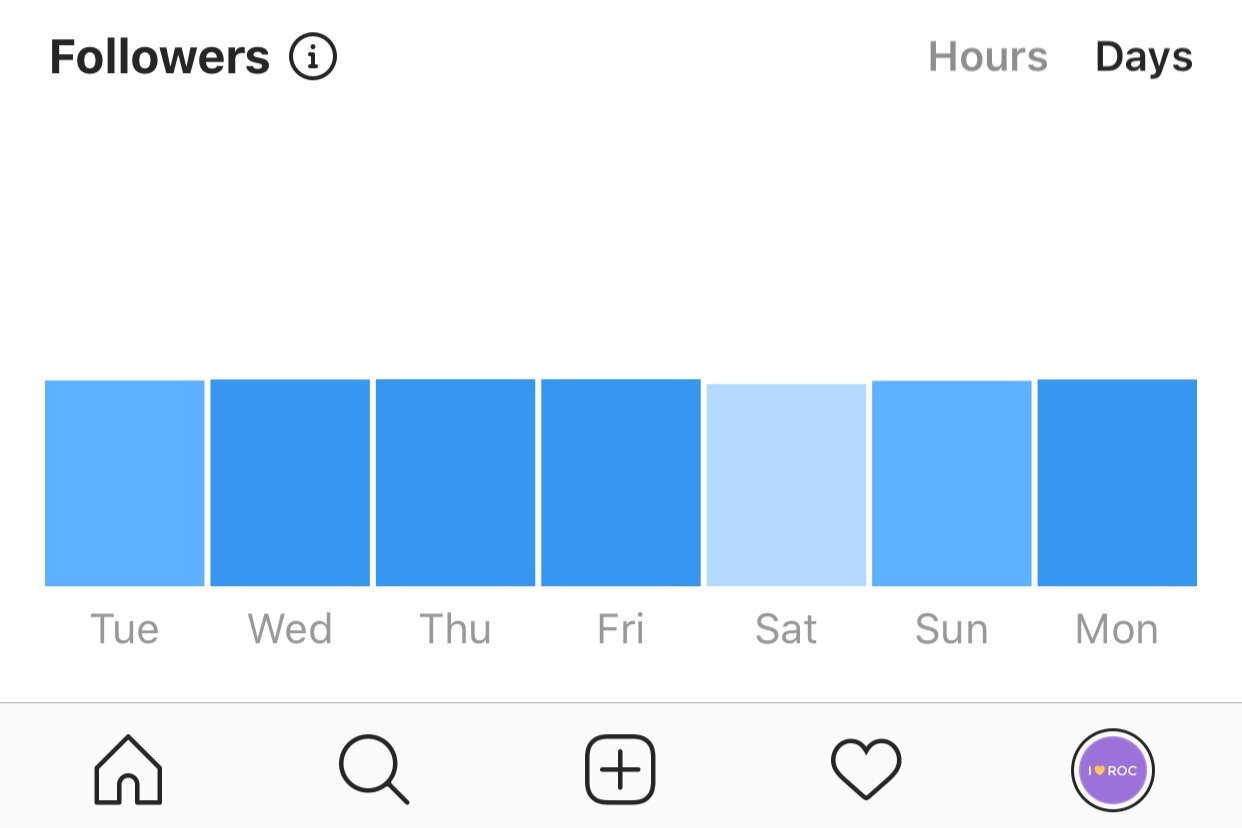
Last but not least, you can take a look at the followers section and review the hours and days when they’re online. Often, I’ll see a pretty flat line from 9am-9pm, meaning my followers are basically online all the time. I tend to see more variability based on day of the week, as some people are on their phone less during the weekends versus the workweek. This can be incredibly useful for figuring out when your followers are online and when to post. If they’re always online in the evenings, then you’ll want to schedule your posts for the evening.
Now What?
You’ve got so much data at your fingertips, and now you know how to find it and what it means! The end goal in reviewing all of this is to adjust your content strategy based on what’s working and what isn’t. Which posts get amazing engagement and which ones flop? Are certain posts getting shared far more than others? Find the themes, types of photos, or what kind of copy resonates most, and give your audience more of that!
It’s important to remember that metrics can only tell you so much--they never tell the whole story. In our interview with Lianna Pisani, she emphasized the value of qualitative data. Often comments and messages can provide helpful context to accompany the numbers. Don’t let the numbers hinder your creativity! Review your analytics regularly, experiment freely, and use the data to guide the strategic moves you’re making. Good luck and happy Instagramming!
For more social media insights, be sure to sign up for my unboring email newsletter.
