
How to Review Your Twitter Analytics
/
This week we’re continuing our series on reviewing your analytics. Last time, we talked about all things Instagram Insights, and today we’re diving into the world of Twitter analytics. Most people have enough trouble figuring out how to build a strong Twitter presence, let alone how to make sense of the data in the analytics tab. That’s why I’m walking you through how to review your Twitter analytics so you can use that information to adjust your social media strategy and connect with your target audience.

How to Access Twitter Analytics
When you log onto Twitter on your computer, click on your profile, then click “More,” then “Analytics.” Voila! You’re in. At the top next to where it says Analytics, you’ll see a few options: Home, Tweets, and More (with a dropdown). Under More, you’ll find Videos and Conversion Tracking. Those are a bit advanced, so today we’re going to focus on Home and Tweets. Let’s start with Home.
What You’ll Find
Home Tab
When you first arrive at Twitter Analytics, you’ll be on the Home tab. Here, you’ll see a 28 day summary tracking changes over the previous period. It’ll show you a few key stats from the past 28 days: tweets, tweet impressions, profile visits, mentions, and followers. If you’re not familiar with any of these terms, be sure to check out my Social Media Glossary. “Profile visit” is one term that didn’t make that list of 50 terms, and it’s exactly what it sounds like- how many people clicked on your profile and popped over to take a look at it. This 28 day summary is handy for seeing how you’re doing--are you trending up or down? Do you know why? What’s changed from this month to last? Put your thinking cap on and let’s go!
From here, you can scroll down and look at summaries month by month. In each month’s summary, you’ll find your top tweet, top media tweet, top mention, top follower, and a few other key stats, like how many times you tweeted that month, how many impressions you generated, total profile visits and mentions, and how many new followers you got. In this section, it’s always valuable to see what your top tweet, top media tweet, and top mention were. It can help you start to parse out some themes--are there certain kinds of photos people like to see? Specific kinds of copy? Funnier tweets or more serious ones? When looking at your analytics, it helps to pull qualitative as well as quantitative data. If you’re assembling a Twitter analytics report, be sure to include screenshots of your top performing content and any noteworthy replies you got from followers! It helps to tell the whole story and provide context. For more about the value of qualitative data, check out my interview with digital strategist Lianni Pisani.
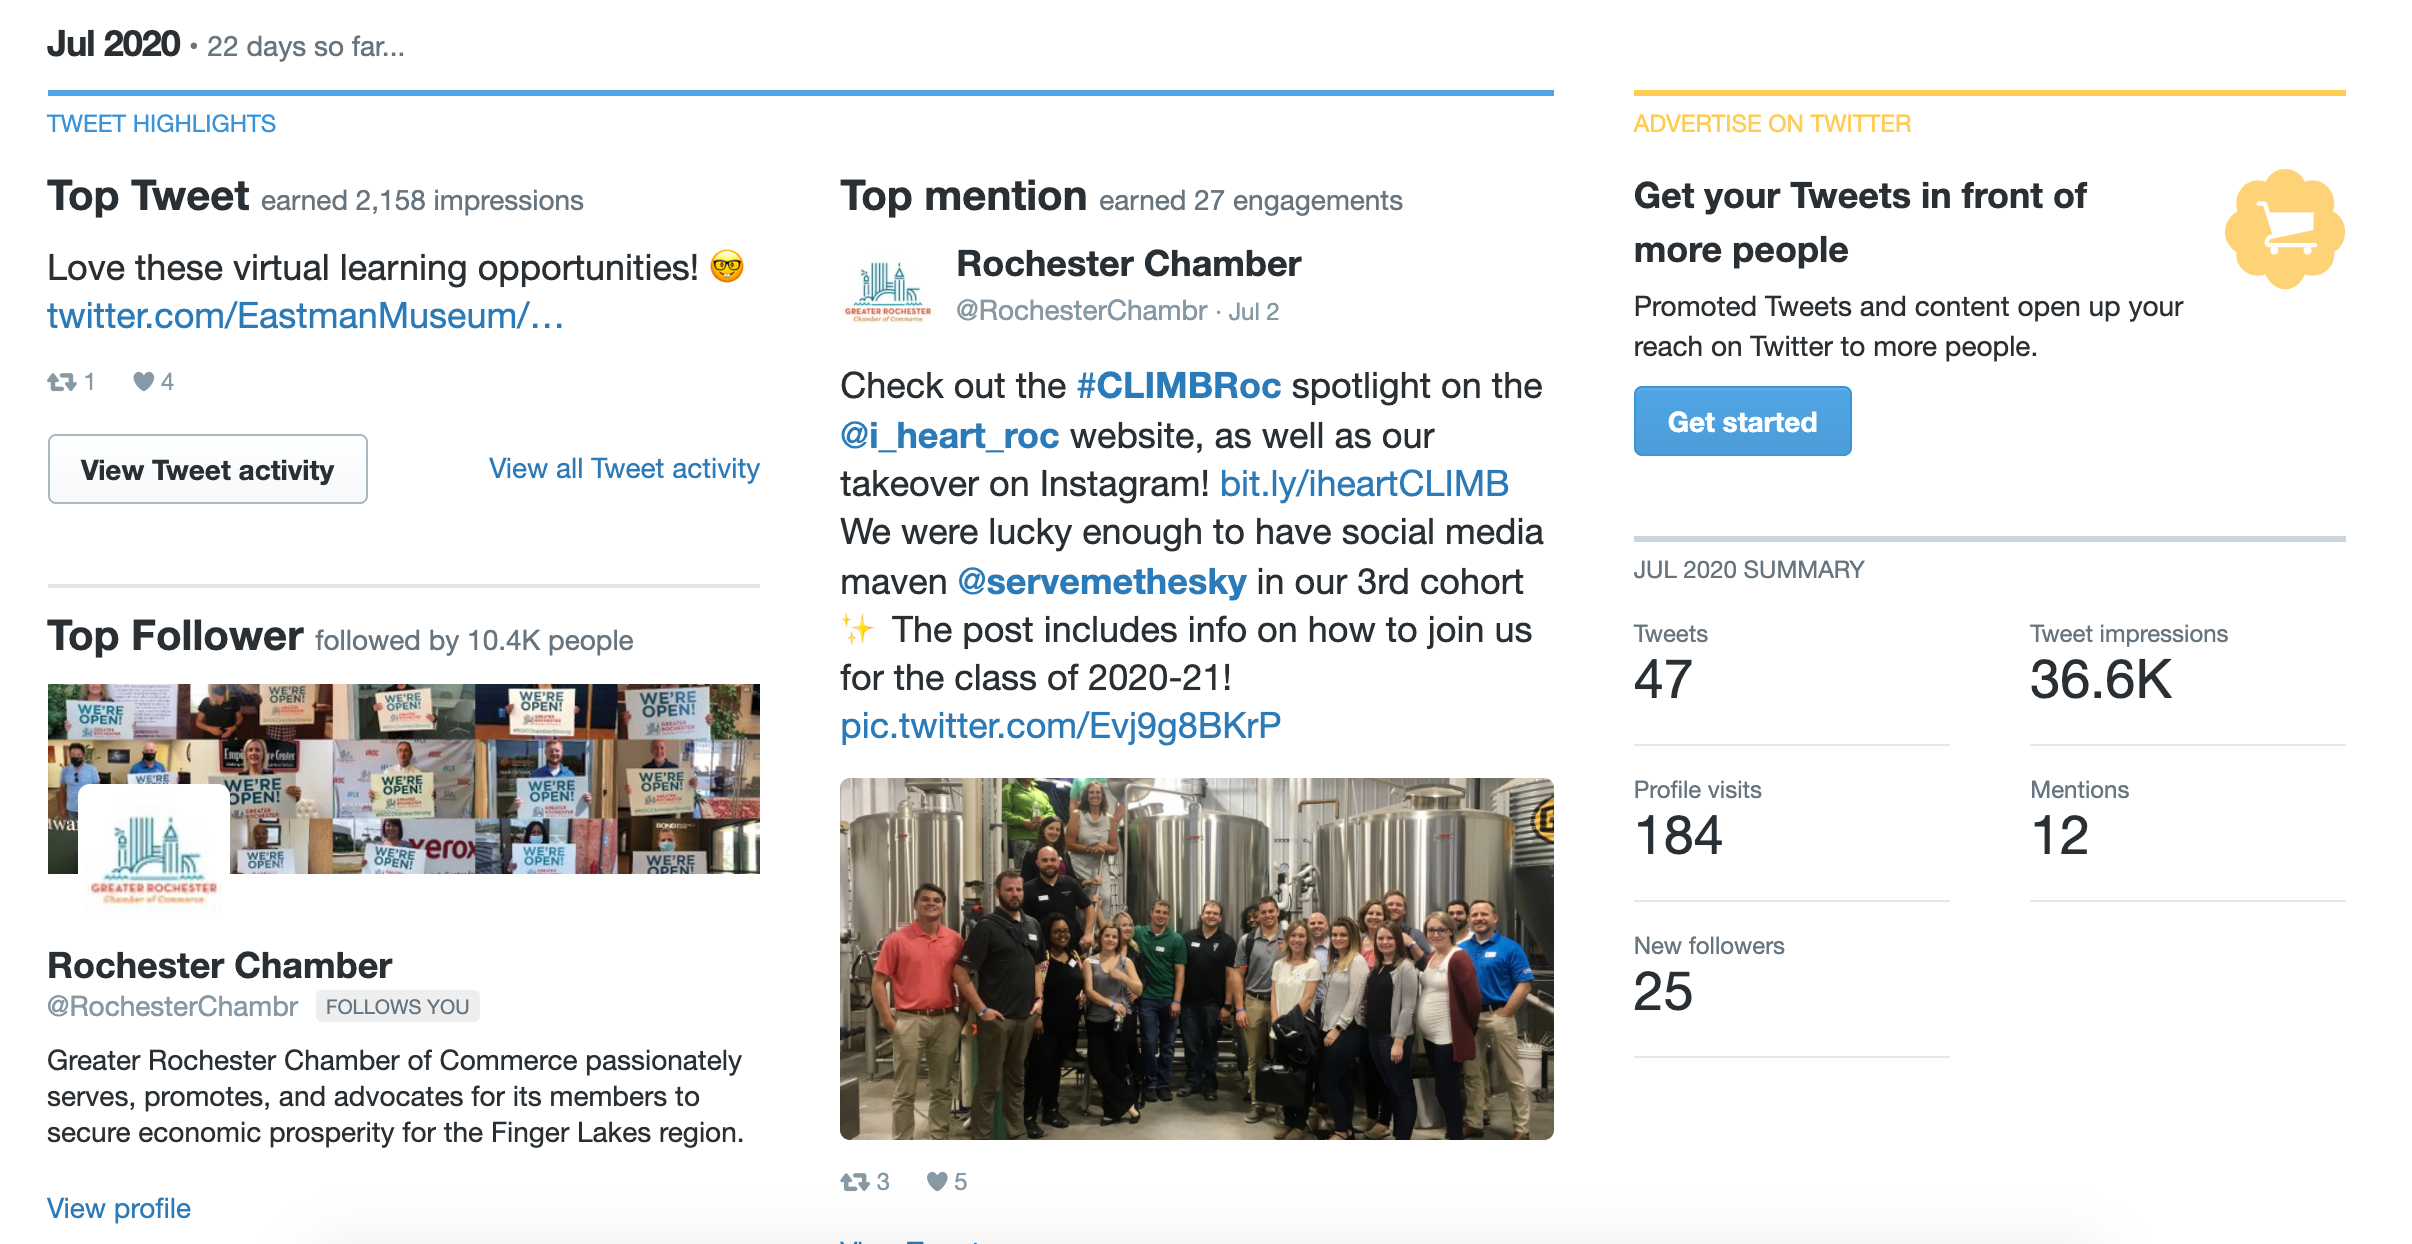
a screenshot of the july 2020 summary for i heart roc
Tweets Tab
If you head back to the top and click on “Tweets,” you can drill down a little deeper. In this section, you can go tweet by tweet and see how many impressions and engagements each tweet generated, as well as the engagement rate. For Twitter, engagement is the retweets, follows, replies, likes, and clicks your tweet gets, including clicks on both hashtags and links. The engagement rate is your tweets’ engagement divided by the number of impressions generated.
On the right hand side, you can also view some averages that Twitter calculates for you. For example, it’ll display averages for: engagement rate, link clicks per day, retweets per day, likes per day, and replies per day.
At the top right, you can also filter the data by specific windows of time. If you want to view tweets from the past three months, just set the dates accordingly and peruse away! You can also export the data into a CSV if you so desire.
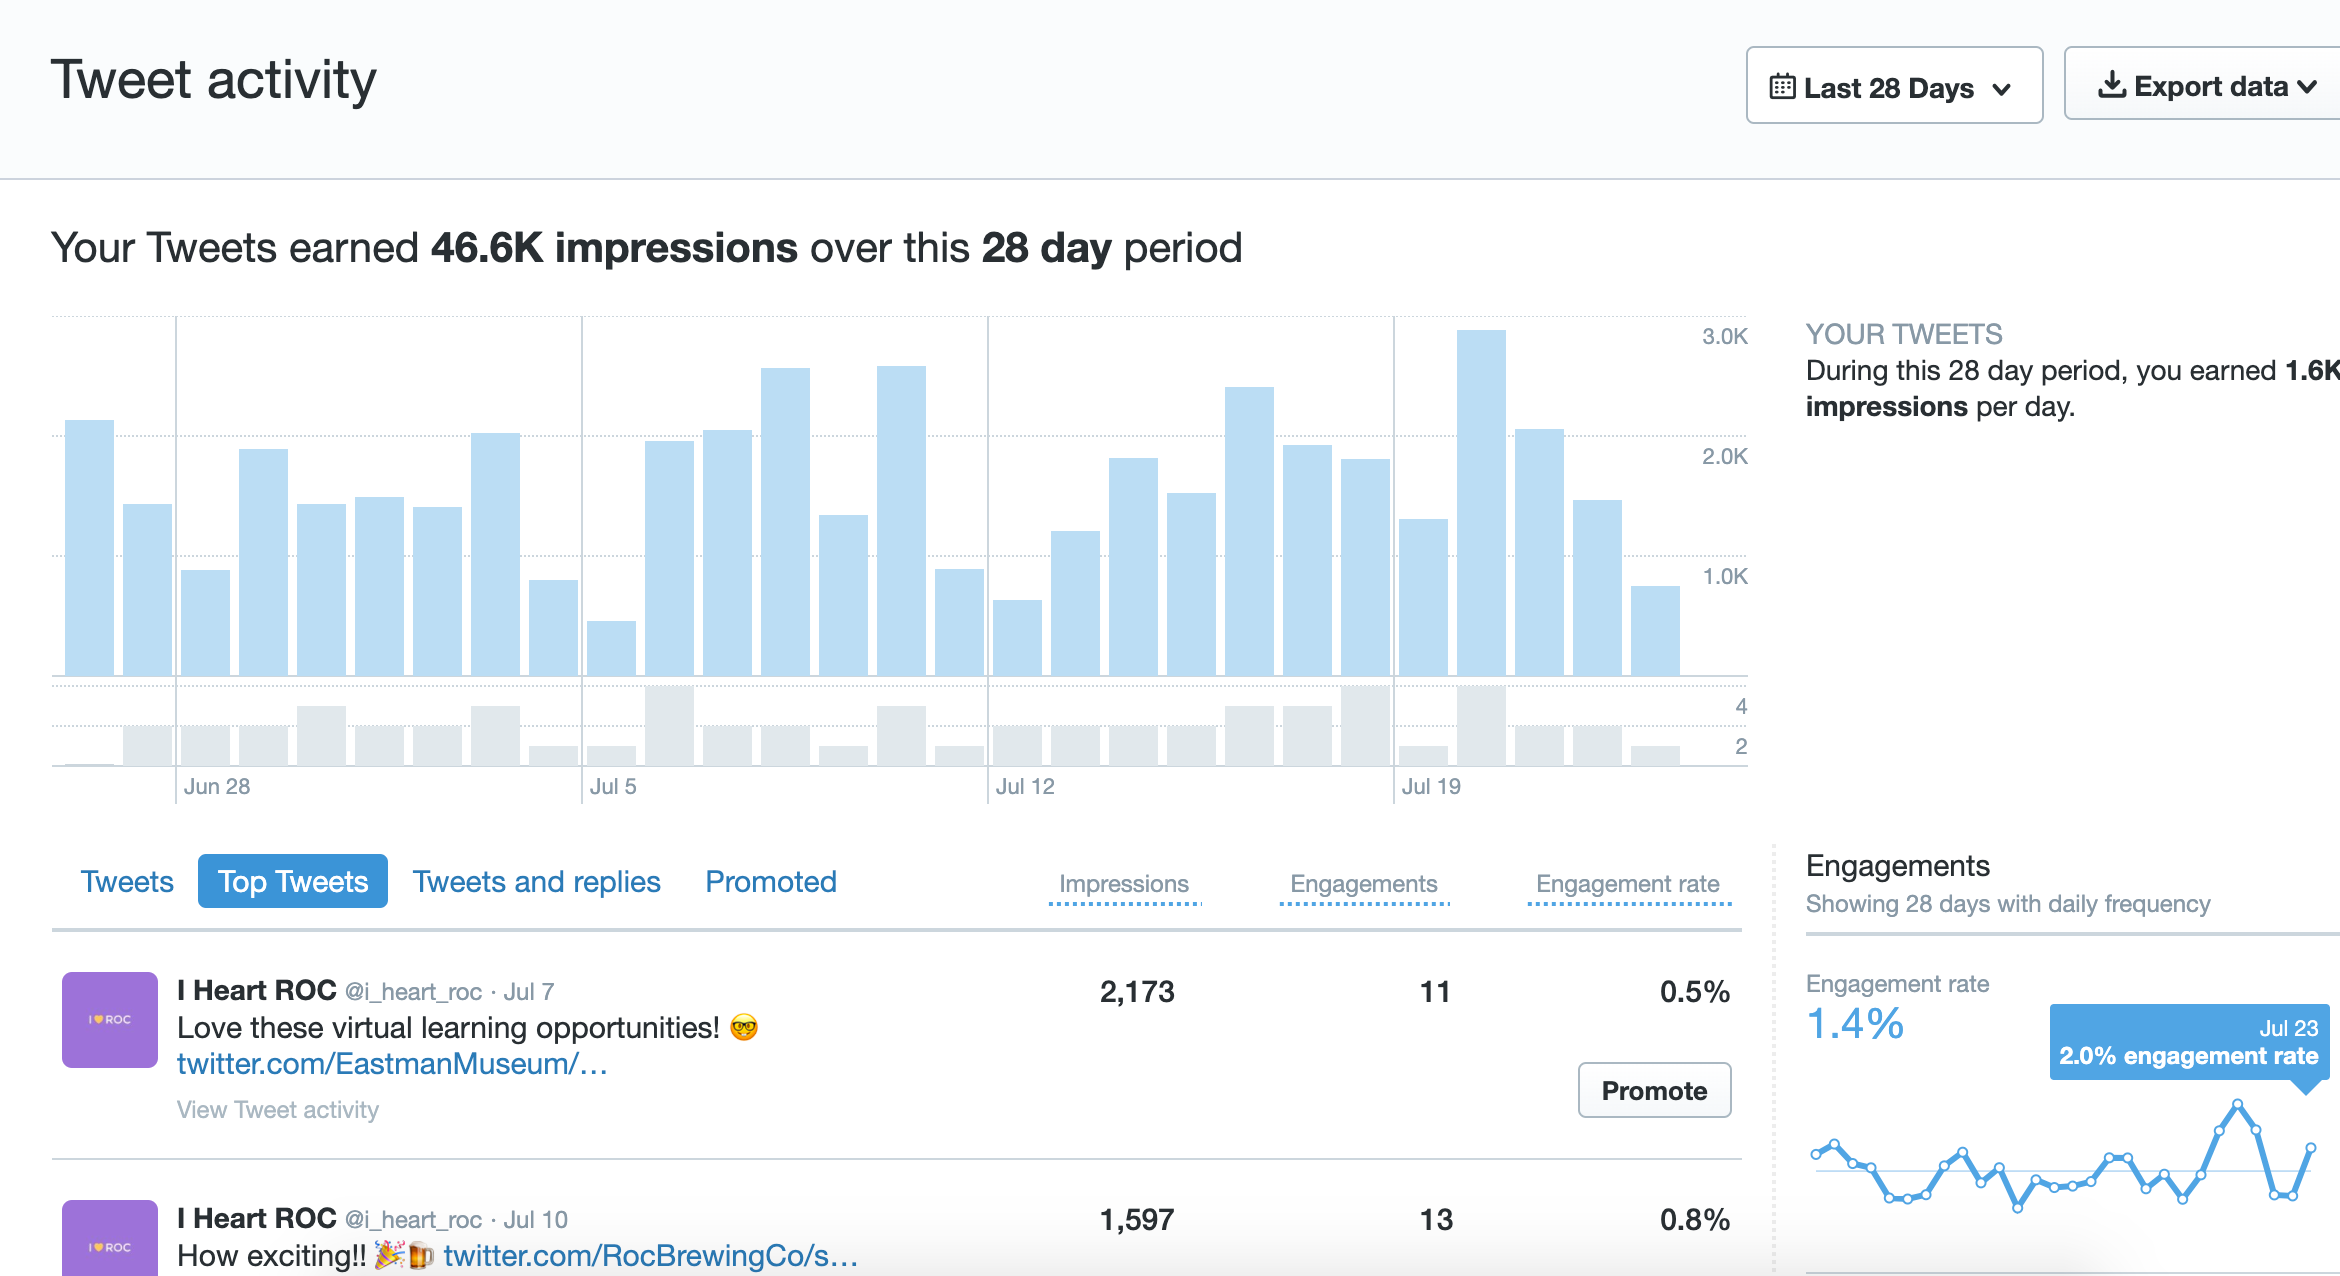
A peek at the tweets tab
Now What?
What’s the point of looking at all this data? It can help shape your content strategy! Reviewing your analytics shows you what types of content and topics your audience members are most interested in. If your funny tweets get way more engagement than your serious ones, maybe it’s time to embrace a playful tone on your social media! Maybe your tweets with emojis are getting far more retweets--lean in and include more emojis! It’s all about finding what resonates with your audience.
Once you’ve tracked this data for awhile, you can also do some benchmarking. That way, you’ll be on top of it if your engagement drops sharply from one month to the next and you can start to analyze why.
Try to dedicate at least one hour a month to reviewing your Twitter analytics--it can be the last Friday of the month or maybe even 15 minutes each Friday morning! This is a great way to start spotting trends and applying your newfound insights to future tweets you craft.
For more social media insights, be sure to sign up for my unboring email newsletter.
