
How to Review Your TikTok Analytics
/
If you’re just getting started with TikTok, it may be tricky to gauge how your content is performing. Luckily, if you have a business account, you can access analytics and review your metrics in more detail than the average TikTok user. Today on the blog, we’re diving into how to determine what’s working and what’s not in your TikTok content strategy based on data.
How to Access TikTok Analytics
First, you’ll want to make sure you actually have a business account. To double check, go to your profile page, select ‘settings and privacy,’ then ‘manage account.’ Once there, you can select ‘Switch to Business Account.’ If you already have a business account, it will say ‘Switch to a Personal Account.’

Accessing analytics
Once you’re sure you have a business account, you can access analytics by tapping the three dotted lines in the upper right corner, then ‘Creator tools,’ then ‘Analytics.’
What You’ll Find
There are four main tabs in the Analytics section: Overview, Content, Followers, and LIVE. I haven’t experimented with live videos yet, so I’ll be focusing on Overview, Content, and Followers.
Overview Tab
Under Overview, you can select the window of time you wish to review: last 7 days, last 28 days, last 60 days, or custom. I typically choose the last 28 days to review the last month or so.
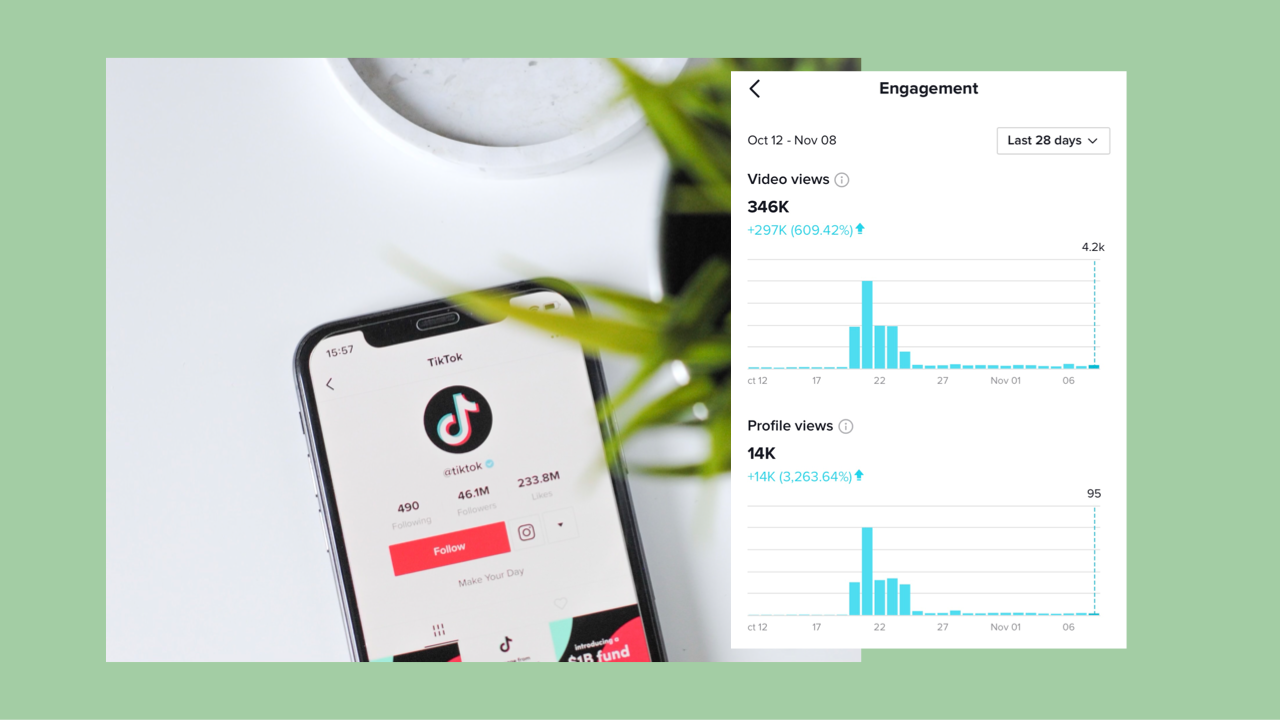
This section offers data on engagement, calculates your growth rate, and explains the terms they’re using. Here are TikTok’s definitions:
Video views: The number of times viewers watched your videos in the selected date range.
Profile views: The number of times your profile was viewed in the selected date range.
Likes: The number of likes your videos received in the selected date range.
Comments: The number of comments your video received in the selected date range.
Shares: The number of shares your videos received in the selected date range.
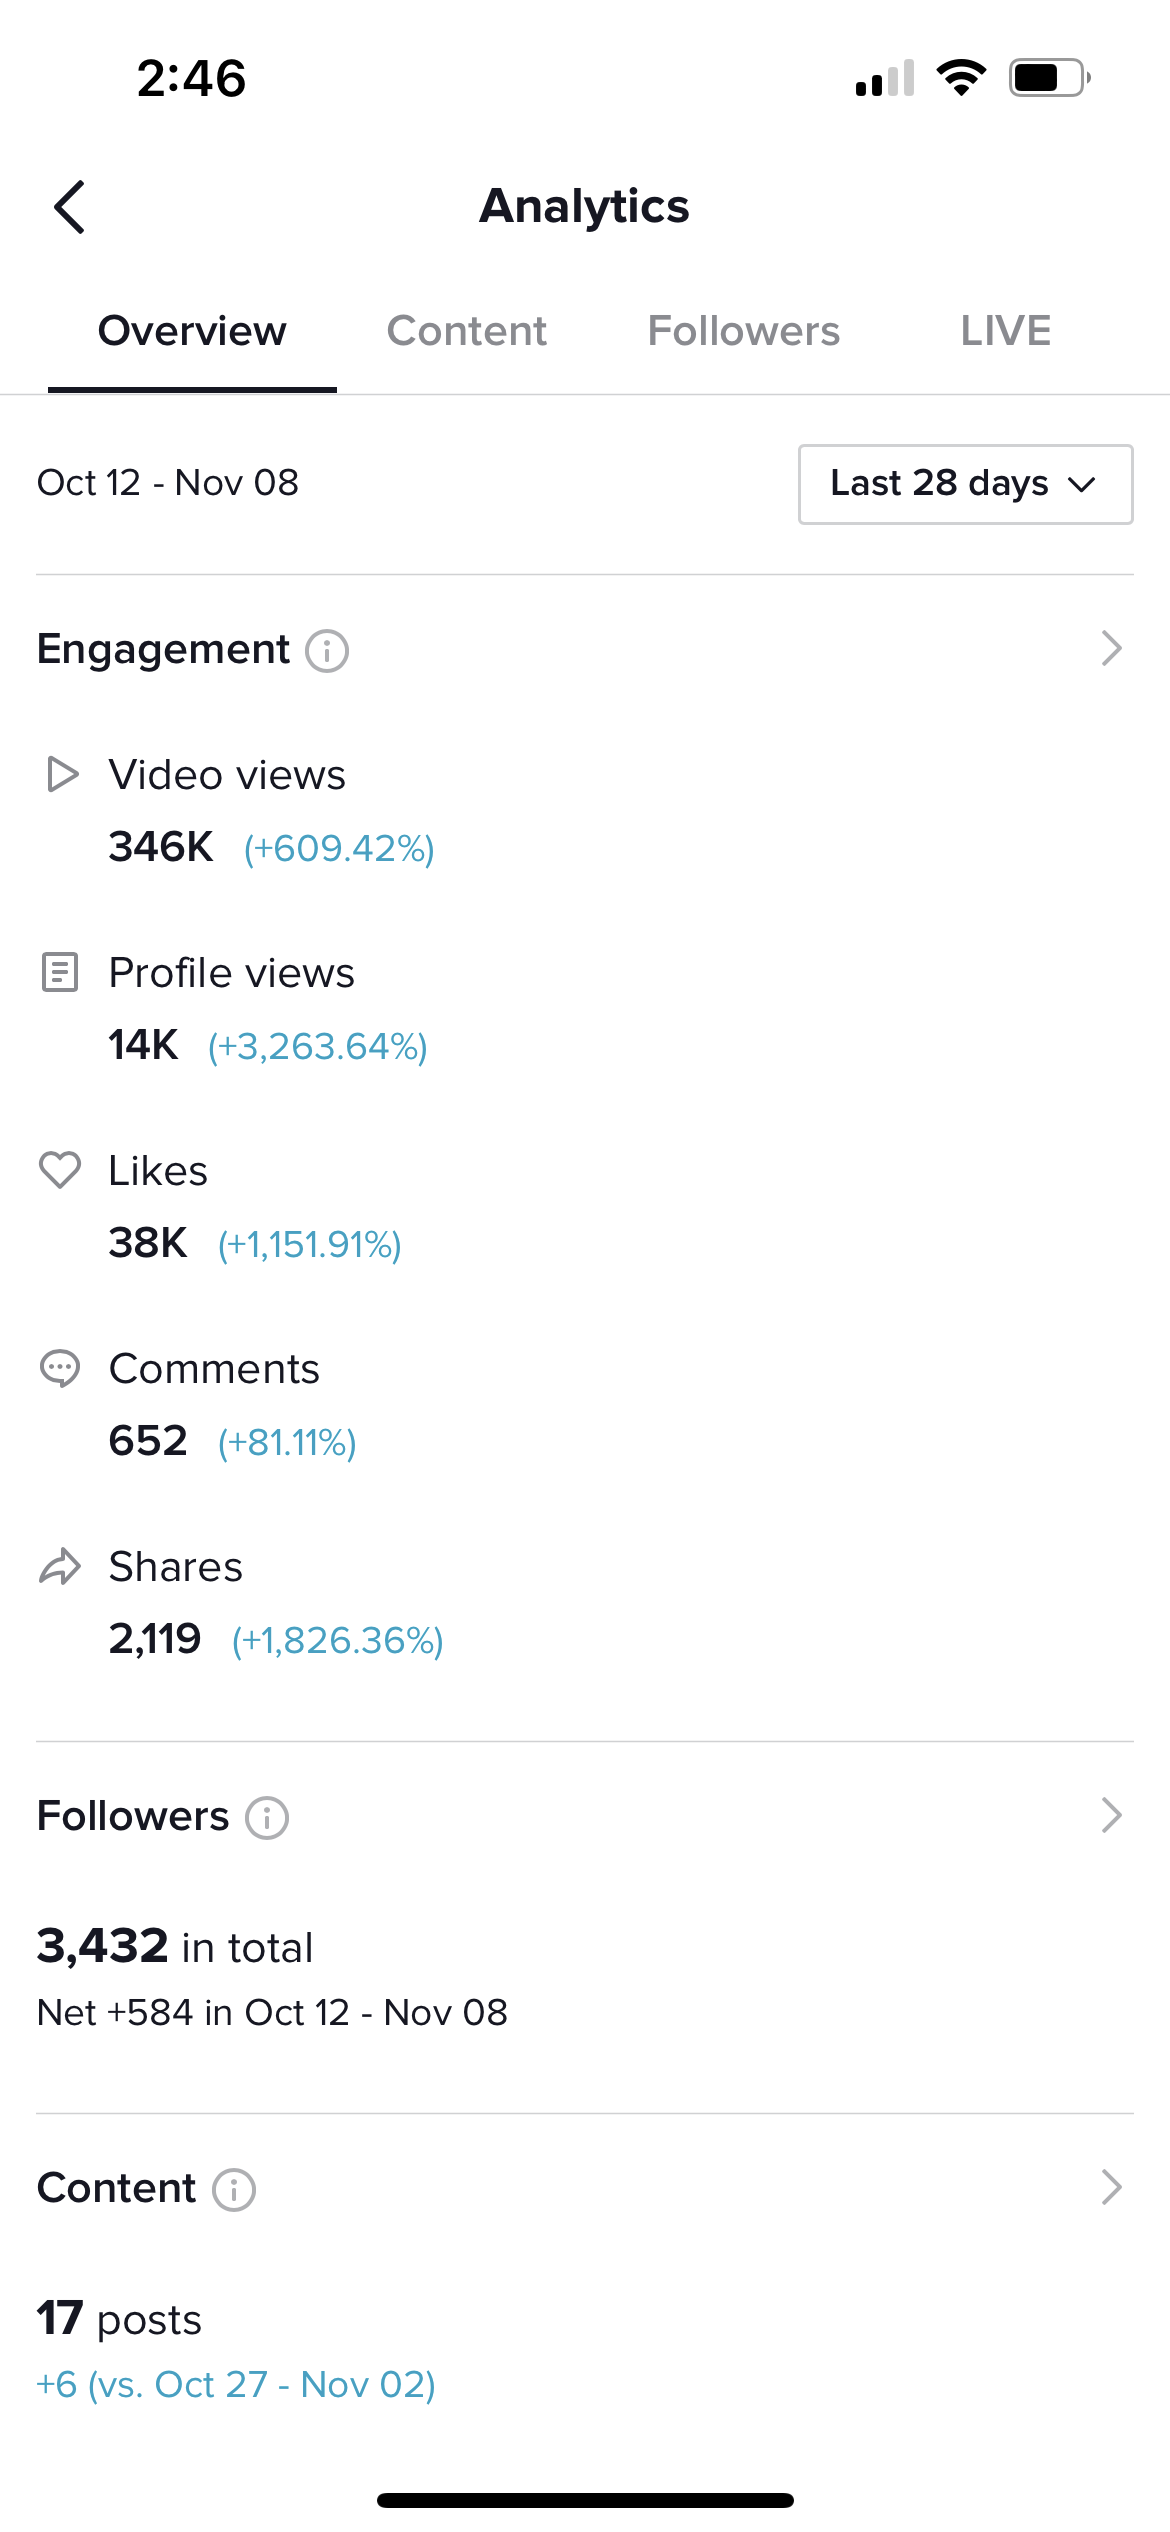
Overview tab example
Content Tab
The content tab gives you a slightly more granular level of detail about the specific videos you’ve shared recently. It displays how many posts you’ve shared in the last 7 days, how that compares to the previous week, and your top 9 videos with the fastest growth from the past 7 days. This can help you determine which videos are getting the most traction. Often, you’ll already be aware of which video(s) are growing the quickest, especially if you have one video that’s really been blowing up lately. Sometimes an older video will unexpectedly be circulating again, which may inspire you to create more content on that topic. It’s useful to assess trends across your videos that are experiencing the most growth. How can you iterate on that and keep delivering content that people want to engage with?
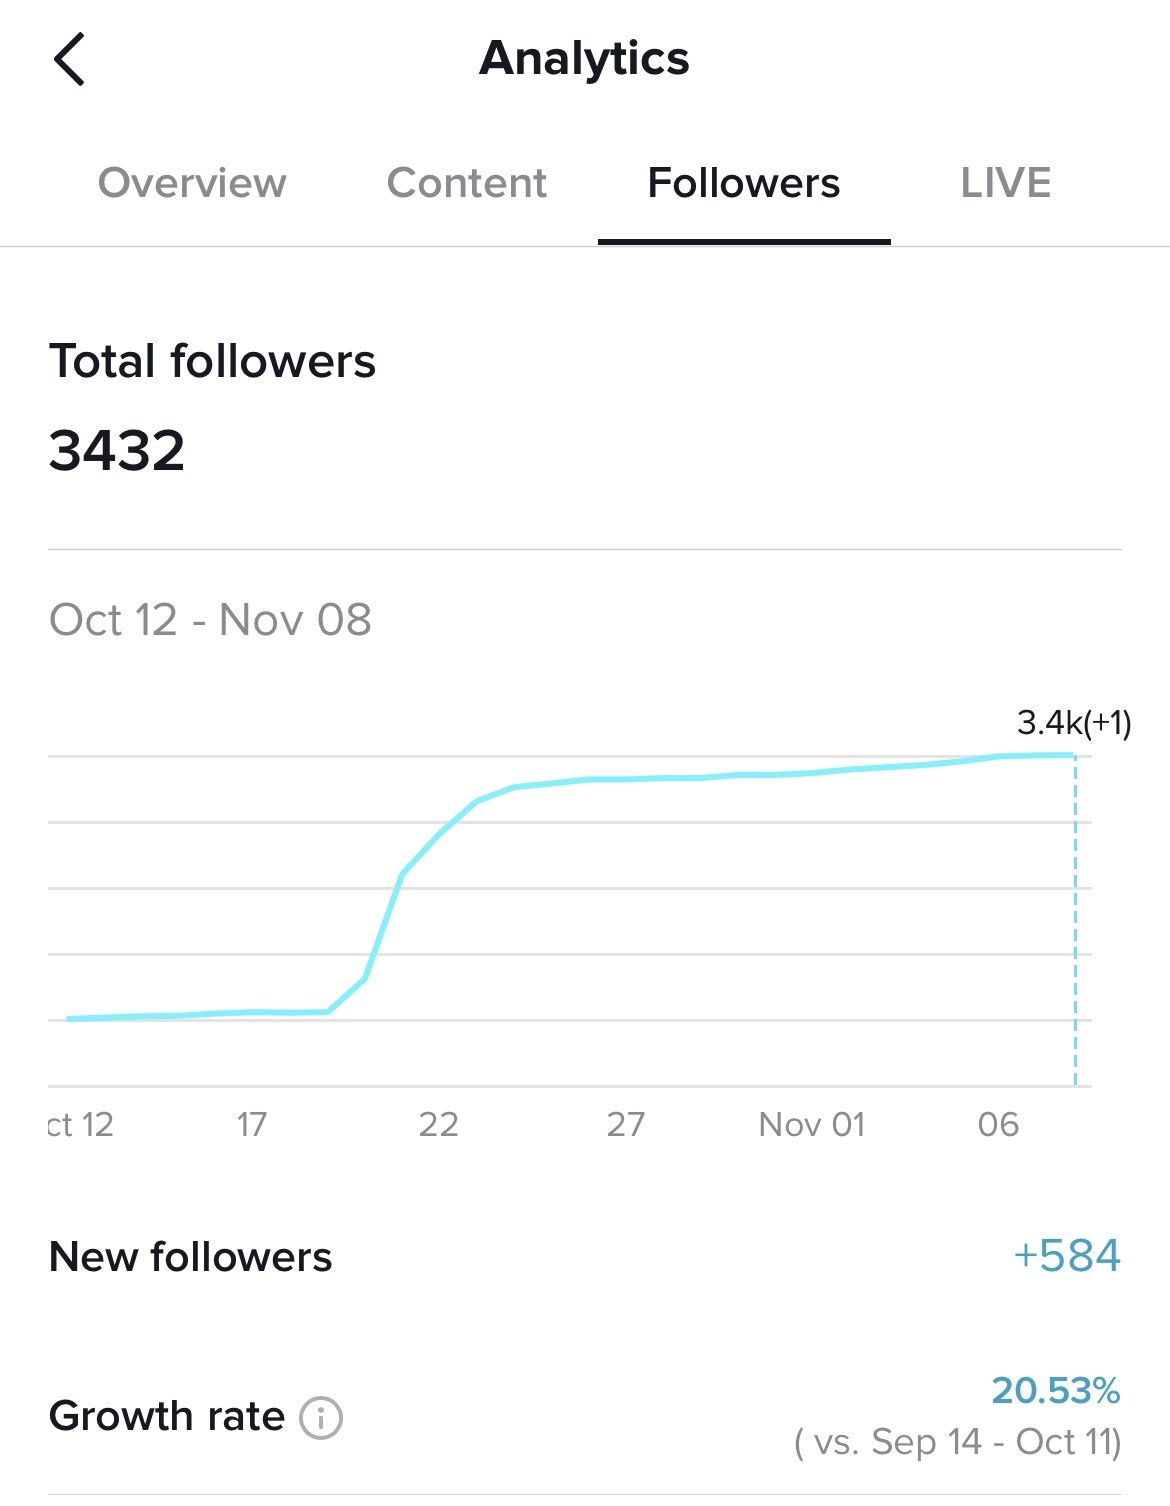
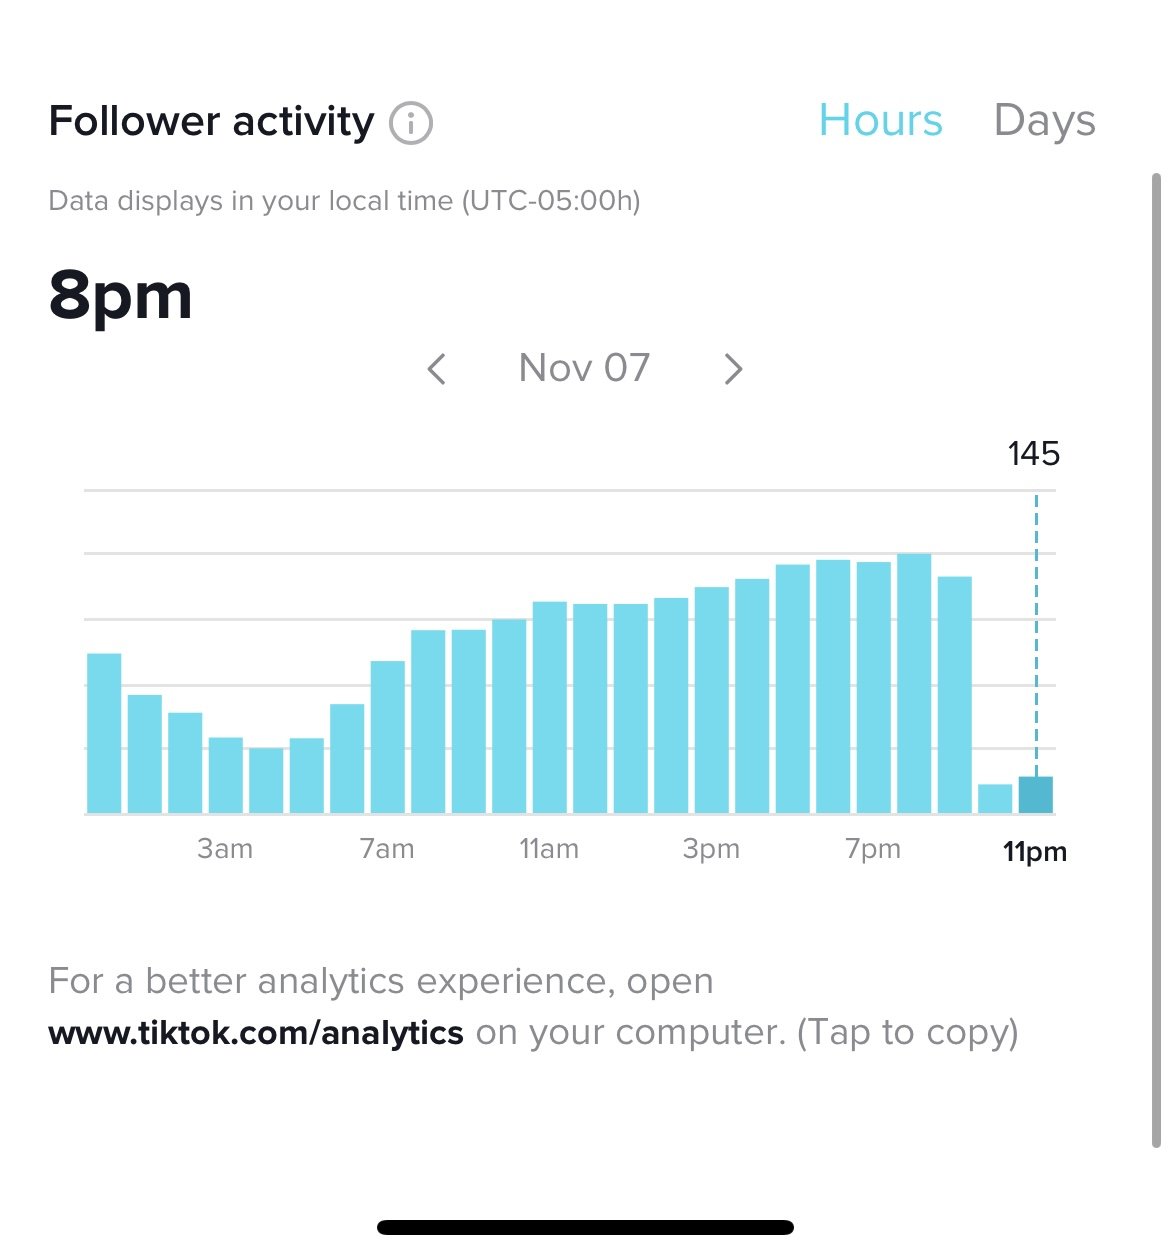
Followers Tab
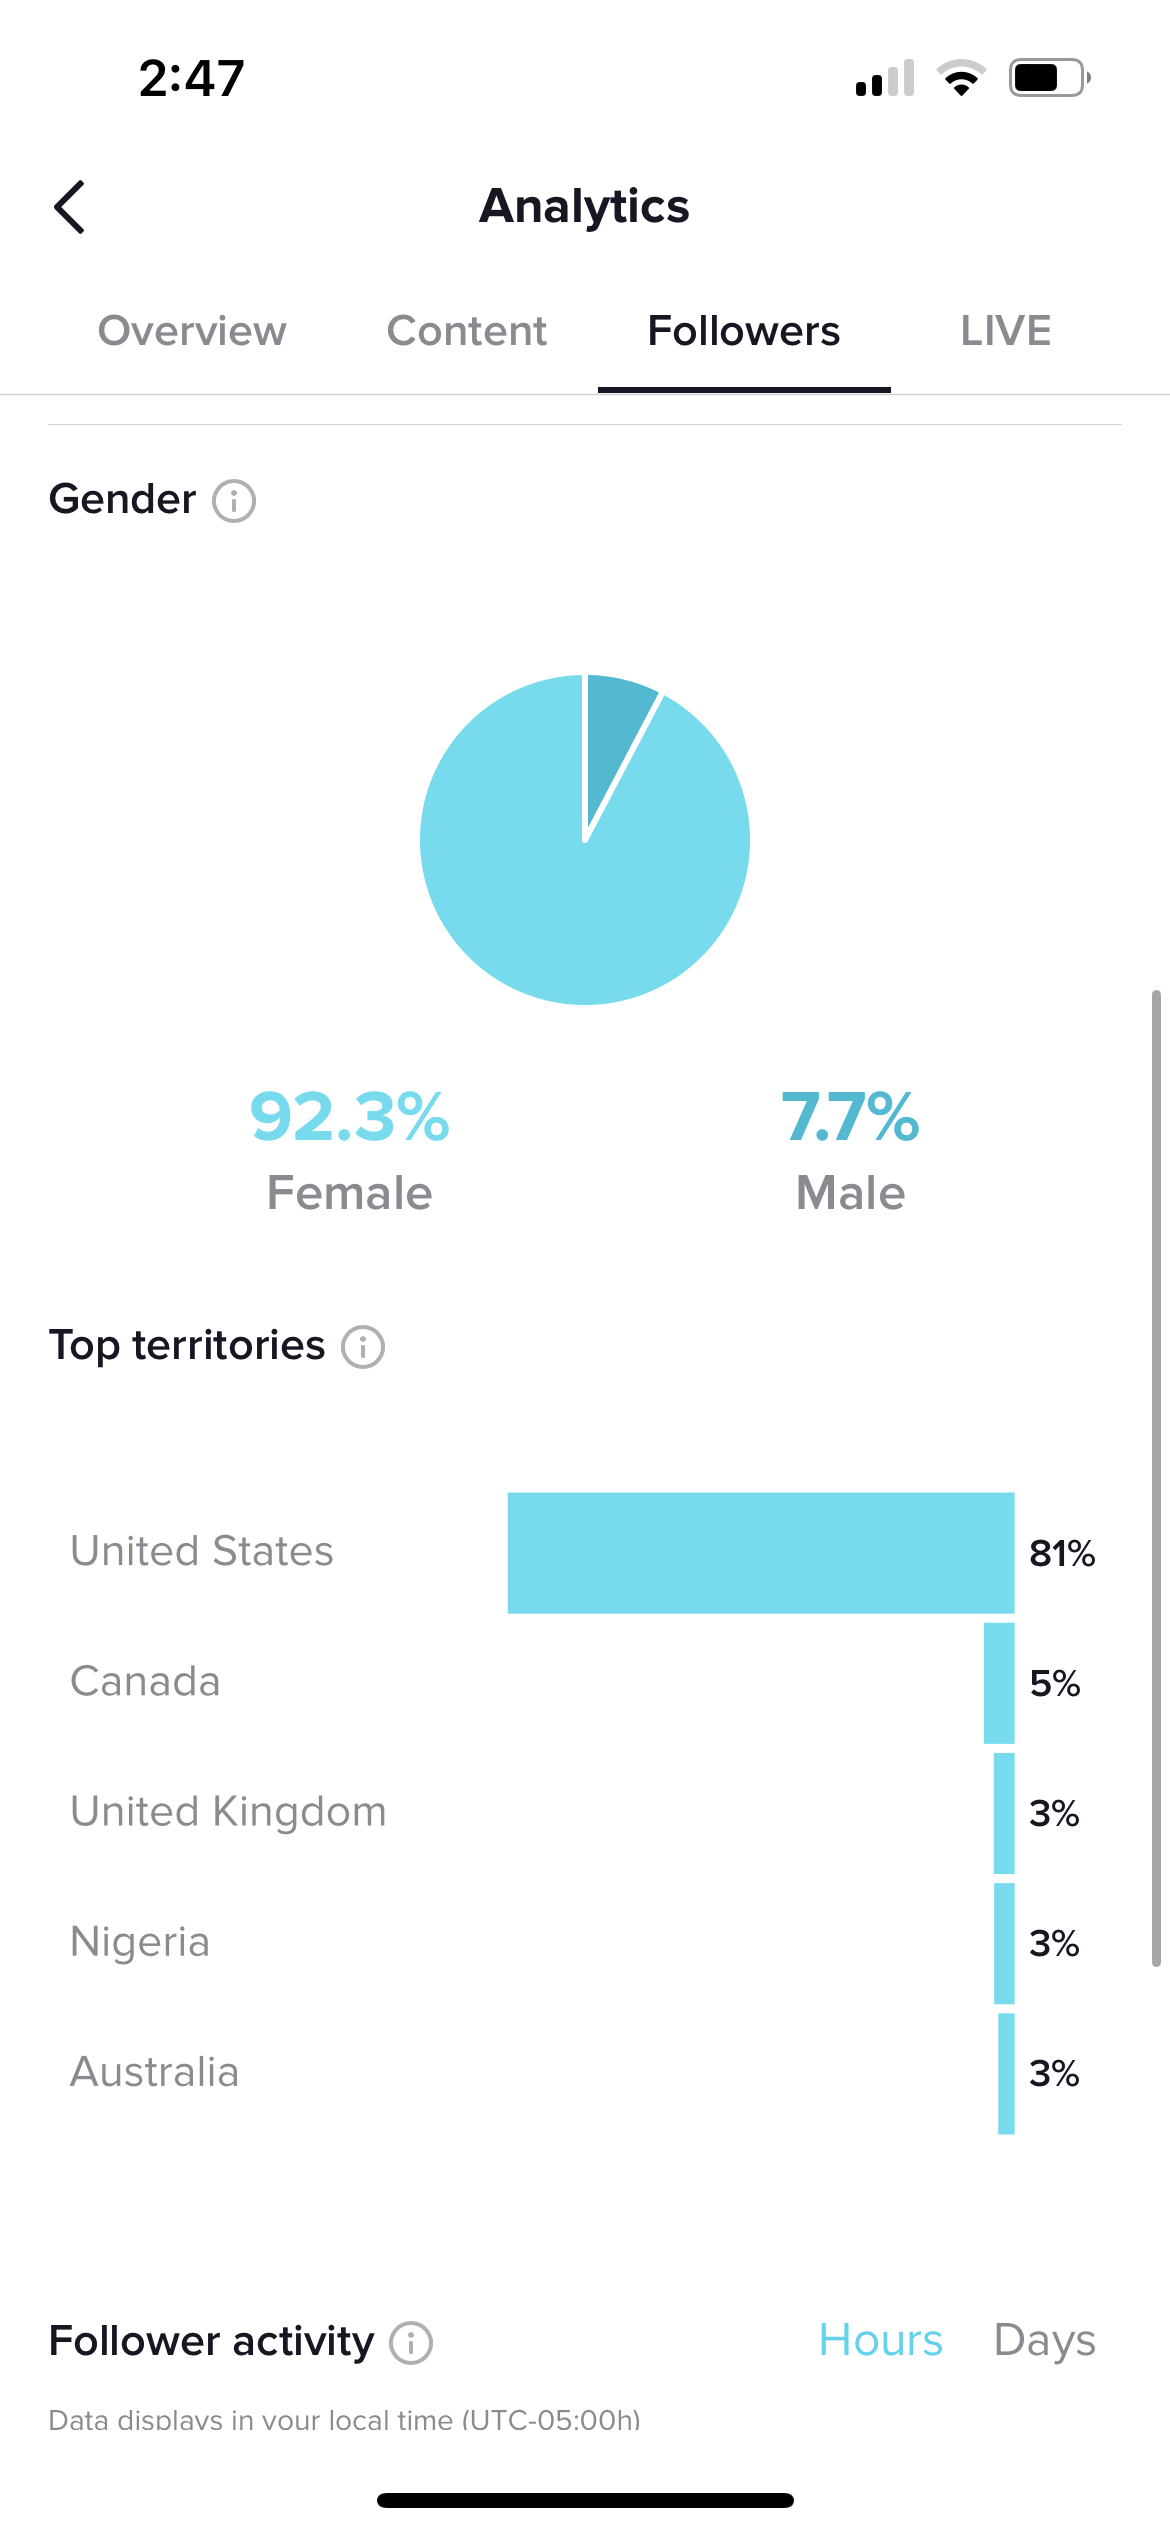
Lastly, the followers tab displays data on your followers in the selected date range. It also calculates your growth rate, meaning the number of followers you gained or dropped compared to the previous date range. In this section, you can also review a breakdown of your followers by gender, where your followers are located, and when they’re online, including both time of day and days of the week. You can use this information to post consistently at times when you know your audience is online, whether that’s weekday evenings or weekend mornings. Whatever the data indicates, plan and post accordingly!
Now What?
So what do you do with this data? Carve out time on your calendar to sit down at least once a month and review your analytics.
When reviewing your TikTok analytics, look for patterns. What types of videos perform the best–talking to the camera? Using a trending audio? Text on a screen? That can be a great jumping off point for what type of content to create more of.
Is there a specific topic folks are really connecting with? Perhaps a video you made about a current event got a lot of views; consider making more time-sensitive content. Or maybe a goofy video got more engagement than you anticipated–take that and run with it! Observing these trends can help you discover what resonates with folks and create more engaging content.
For more on analytics, check out these past blog posts:
Find more social media insights in my unboring email newsletter!
